Fayl:Carbon cycle-cute diagram.svg
Naviqasiyaya keç
Axtarışa keç

Bu SVG-faylın PNG formatındakı bu görünüşünün ölçüsü: 600 × 460 piksel. Digər ölçülər: 313 × 240 piksel | 626 × 480 piksel | 1.002 × 768 piksel | 1.280 × 981 piksel | 2.560 × 1.963 piksel.
Faylın orijinalı (SVG faylı, nominal olaraq 600 × 460 piksel, faylın ölçüsü: 65 KB)
| Bu fayl "Vikimedia Commons"dadır və digər layihələrdə istifadə edilə bilər. |
 |
Faylın təsvir səhifəsinə get |
Xülasə
| İzah |
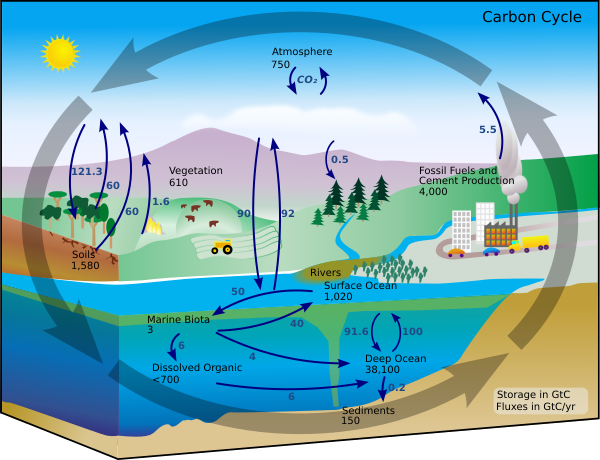
Deutsch: Diagramm des Kohlenstoffkreislaufes. Die schwarzen Zahlen zeigen wie viele Milliarden Tonnen Kohlenstoff (Gt C) in den verschiedenen Resevoiren vorhanden sind. Die blauen Zahlen zeigen an, wie viel Kohlenstoff zwischen den einzelnen Speichern pro Jahr ausgetauscht wird.
English: This carbon cycle diagram shows the storage and annual exchange of carbon between the atmosphere, hydrosphere and geosphere in gigatons - or billions of tons - of Carbon (GtC). Burning fossil fuels by people adds about 5.5 GtC of carbon per year into the atmosphere.
Español: Este esquema del ciclo del carbono muestra el almacenamiento y los cambios anuales del s entre la atmósfera, la hidrósfera y la geósfera en gigatones, o miles de millones de toneladas, de carbono (GtC). La quema de combustibles fósiles libera cerca de 5.5 mil millones de toneladas de carbono al año en la atmósfera.
Galego: Este esquema do ciclo do carbono amosa o almacenamento e os cambios anuais do carbono entre a atmosfera, a hidrosfera e a xeosfera en xigatóns, ou miles de millóns de toneladas, de carbono (XtC). A queima de combustibles fósiles libera preto de 5.5 mil millóns de toneladas de carbono ó ano na atmosfera.
日本語: 炭素循環の概念図。黒の数値はそれぞれのリザーバーに存在する炭素量、青の数値はリザーバー間での年間の炭素の移動量。単位はギガt(10億トン)
Русский: Схема геохимического цикла углерода показывает количество углерода в атмосфере, гидросфере и геосфере Земли, а также годовой перенос углерода между ними. Все величины приведены в гигатоннах (миллиардах тонн). В результате сжигания ископаемого топлива, человечество ежегодно добавляет 5,5 гигатонн углерода в атмосферу. |
||
| Tarix | |||
| Mənbə | Own work based on: Carbon cycle-cute diagram.jpeg (i.e. https://earthobservatory.nasa.gov/features/CarbonCycle) | ||
| Müəllif |
Vektor: |
||
| İcazə (Faylın təkrar istifadəsi) |
|
||
| Digər versiyalar |
File:Carbon cycle-cute diagram.svg has 18 embedded translations.
[] Single-language versions
|
||
| SVG genesis | This diagram was created with Inkscape. This diagram is translated using SVG switch elements: all translations are stored in the same file. |


Orijinal yükləmə gündəliyi
This image is a derivative work of the following images:
- File:Carbon cycle-cute diagram.jpeg licensed with PD-USGov-NASA, PD-USGov-NASA/copyright
- 2006-09-12T15:16:24Z Giac83 540x417 (53453 Bytes) {{Information| |Description= This [[:en:carbon cycle]] diagram shows the storage and yearly changes of the carbon between the [[:en:Earth's atmosphere|atmosphere]], [[:en:hydrosphere]] and [[:en:geosphere]] in Gigatons - or b
Uploaded with derivativeFX
Faylın tarixçəsi
Faylın əvvəlki versiyasını görmək üçün gün/tarix bölməsindəki tarixlərə klikləyin.
| Tarix/Vaxt | Kiçik şəkil | Ölçülər | İstifadəçi | Şərh | |
|---|---|---|---|---|---|
| 07:08, 1 iyun 2010 |  | 540 × 417 (186 KB) | Dub4u | Reverted to version as of 03:49, 1 June 2010 | |
| 06:35, 1 iyun 2010 |  | 540 × 417 (165 KB) | Dub4u | Again, trying to get around librsvg-ERROR | |
| 03:49, 1 iyun 2010 |  | 540 × 417 (186 KB) | Dub4u | Reverted to version as of 21:24, 16 July 2009 | |
| 00:29, 1 iyun 2010 |  | 540 × 417 (171 KB) | Dub4u | "Stroke to Path", still trying to fix librsvg-ERROR | |
| 00:20, 1 iyun 2010 |  | 540 × 417 (152 KB) | Dub4u | SVG saved as "Plain SVG" in Inkscape to fix librsvg-ERROR of previous version | |
| 00:07, 1 iyun 2010 |  | 540 × 417 (159 KB) | Dub4u | Added flow totals between terrestrial and atmosphere. | |
| 21:24, 16 iyul 2009 |  | 540 × 417 (186 KB) | Jarl Arntzen | 1. Corrected direction of 90Gt arrow, now going up from the ocean, not down into it. 2. Enlarged arrow head of all arrows to make the direction clearer. 3. Made all text for fluxes in blue instead of indigo to make it more distingt from the black text. | |
| 02:20, 1 iyun 2008 |  | 540 × 417 (151 KB) | FischX | {{Information |Description= |Source= |Date= |Author= |Permission= |other_versions= }} | |
| 02:17, 30 may 2008 |  | 540 × 417 (123 KB) | FischX | {{Information |Description= |Source= |Date= |Author= |Permission= |other_versions= }} | |
| 02:03, 30 may 2008 |  | 540 × 417 (123 KB) | FischX | {{Information |Description={{en|This carbon cycle diagram shows the storage and annual exchange of carbon between the atmosphere, hydrosphere and geosphere in gigatons - |
Fayl keçidləri
Aşağıdakı səhifə bu faylı istifadə edir:
Faylın qlobal istifadəsi
Bu fayl aşağıdakı vikilərdə istifadə olunur:
- af.wikipedia.org layihəsində istifadəsi
- ami.wikipedia.org layihəsində istifadəsi
- ar.wikipedia.org layihəsində istifadəsi
- ast.wikipedia.org layihəsində istifadəsi
- as.wikipedia.org layihəsində istifadəsi
- beta.wikiversity.org layihəsində istifadəsi
- bg.wikipedia.org layihəsində istifadəsi
- bs.wikipedia.org layihəsində istifadəsi
- cs.wikipedia.org layihəsində istifadəsi
- da.wikipedia.org layihəsində istifadəsi
- de.wikipedia.org layihəsində istifadəsi
- de.wikibooks.org layihəsində istifadəsi
- el.wikipedia.org layihəsində istifadəsi
- en.wikipedia.org layihəsində istifadəsi
- Carbon
- Natural capital
- Carbon cycle
- Environmental economics
- Ecological economics
- Kerogen
- Primary production
- Biological pump
- Urban ecology
- Biogeochemical cycle
- C4 carbon fixation
- Photorespiration
- Solubility pump
- Continental shelf pump
- Dissolved inorganic carbon
- Total organic carbon
- Carbonate compensation depth
- Redfield ratio
- Carbon-based life
- Black carbon
Bu faylın qlobal istifadəsinə baxın.