Fayl:Correlation of gas production and seismicity Groningen Vlek 2019 EnvEarthSci 78(3) 59 fig 3.png
Naviqasiyaya keç
Axtarışa keç

Sınaq göstərişi ölçüsü: 487 × 600 piksel. Digər ölçülər: 195 × 240 piksel | 390 × 480 piksel | 624 × 768 piksel | 1.030 × 1.268 piksel.
Faylın orijinalı (1.030 × 1.268 piksel, fayl həcmi: 314 KB, MIME növü: image/png)
| Bu fayl "Vikimedia Commons"dadır və digər layihələrdə istifadə edilə bilər. |
_59_fig_3.png?uselang=az) |
Faylın təsvir səhifəsinə get |
_59_fig_3.png)
Xülasə
| İzah |
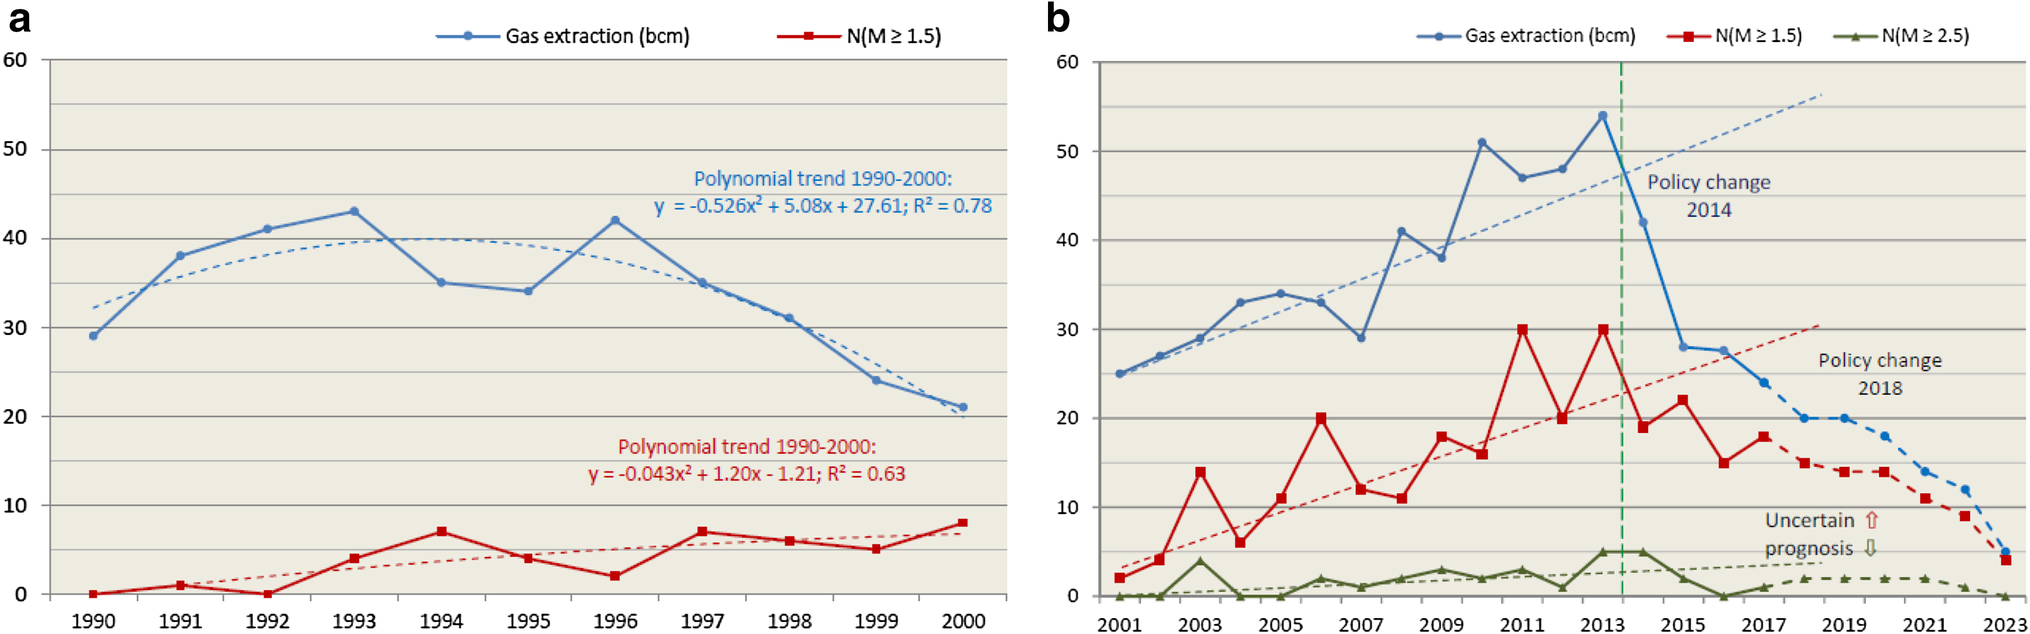
English: Original figure caption: a, b Annual gas extraction (bcm; upper curve) versus annual number (N) of earthquakes with M ≥ 1.5 and ≥ 2.5 (Richter; lower curves). The ordinate (y) fits both annual bcm and earthquake frequency. Basic data from NAM (2016a, 2018) and KNMI (2018). Statistical trends (dashed) over time have been separately fitted for periods 1990–2000 (a) and 2001–2013 (b), excluding 2014–2018.
Deutsch: Induzierte Seismizität im Gasfeld Groningen: Jährliche Erdgasförderung (in bcm = milliarden Kubikmeter; blaue obere Kurven) im Vergleich zur jährlichen Anzahl der Erdbeben (N) mit Magnituden ≥1,5 und ≥2,5 (Richterskala; rote bzw. grüne untere Kurve(n)). Die Zahlen an der Ordinate (y-Achse) gelten jeweils für alle Kurven. Die Rohdaten stammen von NAM (2016a, 2018) und KNMI (2018). Die Steigung der Trendlinien (gestrichelt) ist für die Zeiträume 1990–2000 (a) und 2001–2013 (b) jeweils separat berechnet worden, abzüglich des Zeitraumes von 2014–2018. |
| Tarix | (original online publication date) |
| Mənbə | Fig. 3 in: Rise and reduction of induced earthquakes in the Groningen gas field, 1991–2018: statistical trends, social impacts, and policy change. Environmental Earth Sciences 78(3):59, doi:10.1007/s12665-019-8051-4 |
| Müəllif |
|
| İcazə (Faylın təkrar istifadəsi) |
The original version of this image was published in Environmental Earth Sciences journal. On the webpage that contains the HTML version of the respective article (link.springer.com, see DOI link above) it is stated that it “is distributed under the terms of the Creative Commons Attribution 4.0 International License (https://creativecommons.org/licenses/by/4.0/)”. |
Lisenziya
This file is licensed under the Creative Commons Attribution 4.0 International license.
- Azadsınız:
- paylaşmaq – əsəri köçürmək, paylamaq və ötürmək üçün
- remiks etmək – əsəri adaptasiya etmək
- Aşağıdakı şərtlərə riayət etməklə:
- istinad – Müvafiq kredit verməlisiniz, lisenziyaya bir keçid verməlisiniz və dəyişikliklərin olub olmadığını bildirməlisiniz. Bunu hər hansı bir ağlabatan şəkildə edə bilərsiniz, ancaq lisenziyalaşdırıcının sizi və ya istifadənizi təsdiqləməsini təklif edən bir şəkildə deyil.
Faylın tarixçəsi
Faylın əvvəlki versiyasını görmək üçün gün/tarix bölməsindəki tarixlərə klikləyin.
| Tarix/Vaxt | Kiçik şəkil | Ölçülər | İstifadəçi | Şərh | |
|---|---|---|---|---|---|
| indiki | 15:57, 24 may 2019 | | 1.030 × 1.268 (314 KB) | Gretarsson | {{Information |description ={{en|1=Original figure caption: ''a, b Annual gas extraction (bcm; upper curve) versus annual number (N) of earthquakes with M ≥ 1.5 and ≥ 2.5 (Richter; lower curves). The ordinate (y) fits both annual bcm and earthquake frequency. Basic data from NAM (2016a, 2018) and KNMI (2018). Statistical trends (dashed) over time have been separately fitted for periods 1990–2000 (a) and 2001–2013 (b), excluding 2014–2018.''}} {{de|1=Induzierte Seismizität im Gasfeld Groning... |
Fayl keçidləri
Aşağıdakı səhifə bu faylı istifadə edir:
Faylın qlobal istifadəsi
Bu fayl aşağıdakı vikilərdə istifadə olunur:
_59_fig_3.png)