Ərazisinə görə ABŞ-nin ştat və ərazilərinin siyahısı: Redaktələr arasındakı fərq
| Sətir 51: | Sətir 51: | ||
| {{flaqifikasiya|Miçiqan}}<ref>{{cite web|title=Michigan QuickFacts from the US Census Bureau|url=http://www.census.gov/quickfacts/table/PST045215/26|accessdate=28 iyun 2016}}</ref><ref>{{cite web|last1=Shepherd|first1=Jessica|title=Happy birthday, Michigan! 50 facts to celebrate the mitten state|url=http://www.mlive.com/news/index.ssf/2016/01/happy_birthday_michigan_100_fa.html|publisher=MLive Media Group|accessdate=28 iyun 2016|date=26 yanvar 2016}}</ref> ||align=center| {{nts|11}} || {{convert|96713,51|sqmi|km2|0|disp=table}} ||align=center| {{nts|22}} || {{convert|56538,90|sqmi|km2|0|disp=table}} || align=right| {{percentage|56538,9|96713,51|pad=2}} ||align=center| {{nts|2}} || {{convert|40174,61|sqmi|km2|0|disp=table}} || align=right| {{percentage|40174,61|96713,51|pad=2}} |
| {{flaqifikasiya|Miçiqan}}<ref>{{cite web|title=Michigan QuickFacts from the US Census Bureau|url=http://www.census.gov/quickfacts/table/PST045215/26|accessdate=28 iyun 2016}}</ref><ref>{{cite web|last1=Shepherd|first1=Jessica|title=Happy birthday, Michigan! 50 facts to celebrate the mitten state|url=http://www.mlive.com/news/index.ssf/2016/01/happy_birthday_michigan_100_fa.html|publisher=MLive Media Group|accessdate=28 iyun 2016|date=26 yanvar 2016}}</ref> ||align=center| {{nts|11}} || {{convert|96713,51|sqmi|km2|0|disp=table}} ||align=center| {{nts|22}} || {{convert|56538,90|sqmi|km2|0|disp=table}} || align=right| {{percentage|56538,9|96713,51|pad=2}} ||align=center| {{nts|2}} || {{convert|40174,61|sqmi|km2|0|disp=table}} || align=right| {{percentage|40174,61|96713,51|pad=2}} |
||
|- valign="top"|||||||||||||||||||| |
|- valign="top"|||||||||||||||||||| |
||
| {{flaqifikasiya|Minnesota}} ||align=center| {{nts|12}} || {{convert|86935 |
| {{flaqifikasiya|Minnesota}}<ref>{{cite web|title=Minnesota QuickFacts from the US Census Bureau|url=http://www.census.gov/quickfacts/table/PST045215/27|accessdate=29 iyun 2016}}</ref> ||align=center| {{nts|12}} || {{convert|86935,83|sqmi|km2|0|disp=table}} ||align=center| {{nts|14}} || {{convert|79626,74|sqmi|km2|0|disp=table}} || align=right| {{percentage|79626,74|86935,83|pad=2}} ||align=center| {{nts|9}} || {{convert|7309,09|sqmi|km2|0|disp=table}} || align=right| {{percentage|7309,09|86935,83|pad=2}} |
||
|- valign="top"|||||||||||||||||||| |
|- valign="top"|||||||||||||||||||| |
||
| {{flaqifikasiya|Yuta}} ||align=center| {{nts|13}} || {{convert|84896 |
| {{flaqifikasiya|Yuta}}<ref>{{cite web|title=Utah QuickFacts from the US Census Bureau|url=http://www.census.gov/quickfacts/table/PST045215/49|accessdate=29 iyun 2016}}</ref> ||align=center| {{nts|13}} || {{convert|84896,88|sqmi|km2|0|disp=table}} ||align=center| {{nts|12}} || {{convert|82169,62|sqmi|km2|0|disp=table}} || align=right| {{percentage|82169,62|84896,88|pad=2}} ||align=center| {{nts|17}} || {{convert|2727,26|sqmi|km2|0|disp=table}} || align=right| {{percentage|2727,26|84896,88|pad=2}} |
||
|- valign="top"|||||||||||||||||||| |
|- valign="top"|||||||||||||||||||| |
||
| {{flaqifikasiya|Aydaho}} ||align=center| {{nts|14}} || {{convert|83568 |
| {{flaqifikasiya|Aydaho}}<ref>{{cite web|title=Idaho QuickFacts from the US Census Bureau|url=http://www.census.gov/quickfacts/table/PST045215/16|accessdate=29 iyun 2016}}</ref> ||align=center| {{nts|14}} || {{convert|83568,95|sqmi|km2|0|disp=table}} ||align=center| {{nts|11}} || {{convert|82643,12|sqmi|km2|0|disp=table}} || align=right| {{percentage|82643,12|83568,95|pad=2}} ||align=center| {{nts|33}} || {{convert|925,83|sqmi|km2|0|disp=table}} || align=right| {{percentage|925,83|83568,95|pad=2}} |
||
|- valign="top"|||||||||||||||||||| |
|- valign="top"|||||||||||||||||||| |
||
| {{flaqifikasiya|Kanzas}} ||align=center| {{nts|15}} || {{convert|82278 |
| {{flaqifikasiya|Kanzas}}<ref>{{cite web|title=Kansas QuickFacts from the US Census Bureau|url=http://www.census.gov/quickfacts/table/PST045215/20|accessdate=29 iyun 2016}}</ref> ||align=center| {{nts|15}} || {{convert|82278,36|sqmi|km2|0|disp=table}} ||align=center| {{nts|13}} || {{convert|81758,72|sqmi|km2|0|disp=table}} || align=right| {{percentage|81758,72|82278,36|pad=2}} ||align=center| {{nts|42}} || {{convert|519,64|sqmi|km2|0|disp=table}} || align=right| {{percentage|519,64|82278,36|pad=2}} |
||
|- valign="top"|||||||||||||||||||| |
|- valign="top"|||||||||||||||||||| |
||
| {{flaqifikasiya|Nebraska}} ||align=center| {{nts|16}} || {{convert|77347 |
| {{flaqifikasiya|Nebraska}}<ref>{{cite web|title=Nebraska QuickFacts from the US Census Bureau|url=http://www.census.gov/quickfacts/table/PST045215/31|accessdate=29 iyun 2016}}</ref> ||align=center| {{nts|16}} || {{convert|77347,81|sqmi|km2|0|disp=table}} ||align=center| {{nts|15}} || {{convert|76824,17|sqmi|km2|0|disp=table}} || align=right| {{percentage|76824,17|77347,81|pad=2}} ||align=center| {{nts|41}} || {{convert|523,64|sqmi|km2|0|disp=table}} || align=right| {{percentage|523,64|77347,81|pad=2}} |
||
|- valign="top"|||||||||||||||||||| |
|- valign="top"|||||||||||||||||||| |
||
| {{flaqifikasiya|Cənubi Dakota}} ||align=center| {{nts|17}} || {{convert|77115 |
| {{flaqifikasiya|Cənubi Dakota}}<ref>{{cite web|title=South Dakota QuickFacts from the US Census Bureau|url=http://www.census.gov/quickfacts/table/PST045215/46|accessdate=29 iyun 2016}}</ref> ||align=center| {{nts|17}} || {{convert|77115,68|sqmi|km2|0|disp=table}} ||align=center| {{nts|16}} || {{convert|75811,00|sqmi|km2|0|disp=table}} || align=right| {{percentage|75811,00|77115,68|pad=2}} ||align=center| {{nts|29}} || {{convert|1304,68|sqmi|km2|0|disp=table}} || align=right| {{percentage|1304,68|77115,68|pad=2}} |
||
|- valign="top"|||||||||||||||||||| |
|- valign="top"|||||||||||||||||||| |
||
| {{flaqifikasiya|Vaşinqton}} ||align=center| {{nts|18}} || {{convert|71297 |
| {{flaqifikasiya|Vaşinqton}}<ref>{{cite web|title=Washington QuickFacts from the US Census Bureau|url=http://www.census.gov/quickfacts/table/PST045215/53|accessdate=29 iyun 2016}}</ref> ||align=center| {{nts|18}} || {{convert|71297,95|sqmi|km2|0|disp=table}} ||align=center| {{nts|20}} || {{convert|66455,52|sqmi|km2|0|disp=table}} || align=right| {{percentage|66455,52|71297,95|pad=2}} ||align=center| {{nts|11}} || {{convert|4842,43|sqmi|km2|0|disp=table}} || align=right| {{percentage|4842,43|71297,95|pad=2}} |
||
|- valign="top"|||||||||||||||||||| |
|- valign="top"|||||||||||||||||||| |
||
| {{flaqifikasiya|Şimali Dakota}} ||align=center| {{nts|19}} || {{convert|70698 |
| {{flaqifikasiya|Şimali Dakota}}<ref>{{cite web|title=North Dakota QuickFacts from the US Census Bureau|url=http://www.census.gov/quickfacts/table/PST045215/38|accessdate=29 iyun 2016}}</ref> ||align=center| {{nts|19}} || {{convert|70698,32|sqmi|km2|0|disp=table}} ||align=center| {{nts|17}} || {{convert|69000,80|sqmi|km2|0|disp=table}} || align=right| {{percentage|69000,8|70698,32|pad=2}} ||align=center| {{nts|24}} || {{convert|1697,52|sqmi|km2|0|disp=table}} || align=right| {{percentage|1697,52|70698,32|pad=2}} |
||
|- valign="top"|||||||||||||||||||| |
|- valign="top"|||||||||||||||||||| |
||
| {{flaqifikasiya|Oklahoma}} ||align=center| {{nts|20}} || {{convert|69898 |
| {{flaqifikasiya|Oklahoma}}<ref>{{cite web|title=Oklahoma QuickFacts from the US Census Bureau|url=http://www.census.gov/quickfacts/table/PST045215/40|accessdate=29 iyun 2016}}</ref> ||align=center| {{nts|20}} || {{convert|69898,87|sqmi|km2|0|disp=table}} ||align=center| {{nts|19}} || {{convert|68594,92|sqmi|km2|0|disp=table}} || align=right| {{percentage|68594,92|69898,87|pad=2}} ||align=center| {{nts|30}} || {{convert|1303,95|sqmi|km2|0|disp=table}} || align=right| {{percentage|1303,95|69898,87|pad=2}} |
||
|- valign="top"|||||||||||||||||||| |
|- valign="top"|||||||||||||||||||| |
||
| {{flaqifikasiya|Missuri}} ||align=center| {{nts|21}} || {{convert|69706 |
| {{flaqifikasiya|Missuri}}<ref>{{cite web|title=Missouri QuickFacts from the US Census Bureau|url=http://www.census.gov/quickfacts/table/PST045215/29|accessdate=29 iyun 2016}}</ref> ||align=center| {{nts|21}} || {{convert|69706,99|sqmi|km2|0|disp=table}} ||align=center| {{nts|18}} || {{convert|68741,52|sqmi|km2|0|disp=table}} || align=right| {{percentage|68741,52|69706,99|pad=2}} ||align=center| {{nts|32}} || {{convert|965,47|sqmi|km2|0|disp=table}} || align=right| {{percentage|965,47|69706,99|pad=2}} |
||
|- valign="top"|||||||||||||||||||| |
|- valign="top"|||||||||||||||||||| |
||
| {{flaqifikasiya|Florida}} ||align=center| {{nts|22}} || {{convert|65757 |
| {{flaqifikasiya|Florida}}<ref>{{cite web|title=Florida QuickFacts from the US Census Bureau|url=http://www.census.gov/quickfacts/table/PST045215/12|accessdate=29 iyun 2016}}</ref> ||align=center| {{nts|22}} || {{convert|65757,70|sqmi|km2|0|disp=table}} ||align=center| {{nts|26}} || {{convert|53624,76|sqmi|km2|0|disp=table}} || align=right| {{percentage|53624,76|65757,7|pad=2}} ||align=center| {{nts|3}} || {{convert|12132,94|sqmi|km2|0|disp=table}} || align=right| {{percentage|12132,94|65757,7|pad=2}} |
||
|- valign="top"|||||||||||||||||||| |
|- valign="top"|||||||||||||||||||| |
||
| {{flaqifikasiya|Viskonsin}} ||align=center| {{nts|23}} || {{convert|65496 |
| {{flaqifikasiya|Viskonsin}}<ref>{{cite web|title=Wisconsin QuickFacts from the US Census Bureau|url=http://www.census.gov/quickfacts/table/PST045215/55|accessdate=29 iyun 2016}}</ref> ||align=center| {{nts|23}} || {{convert|65496,38|sqmi|km2|0|disp=table}} ||align=center| {{nts|25}} || {{convert|54157,80|sqmi|km2|0|disp=table}} || align=right| {{percentage|54157,8|65496,38|pad=2}} ||align=center| {{nts|4}} || {{convert|11338,57|sqmi|km2|0|disp=table}} || align=right| {{percentage|11338,57|65496,38|pad=2}} |
||
|- valign="top"|||||||||||||||||||| |
|- valign="top"|||||||||||||||||||| |
||
| {{flaqifikasiya|Corciya}} ||align=center| {{nts|24}} || {{convert|59425 |
| {{flaqifikasiya|Corciya}}<ref>{{cite web|title=Georgia QuickFacts from the US Census Bureau|url=http://www.census.gov/quickfacts/table/PST045215/13|accessdate=29 iyun 2016}}</ref> ||align=center| {{nts|24}} || {{convert|59425,15|sqmi|km2|0|disp=table}} ||align=center| {{nts|21}} || {{convert|57513,49|sqmi|km2|0|disp=table}} || align=right| {{percentage|57513,49|59425,15|pad=2}} ||align=center| {{nts|22}} || {{convert|1911,66|sqmi|km2|0|disp=table}} || align=right| {{percentage|1911,66|59425,15|pad=2}} |
||
|- valign="top"|||||||||||||||||||| |
|- valign="top"|||||||||||||||||||| |
||
| {{flaqifikasiya|İllinoys}} ||align=center| {{nts|25}} || {{convert|57913 |
| {{flaqifikasiya|İllinoys}}<ref>{{cite web|title=Illinois QuickFacts from the US Census Bureau|url=http://www.census.gov/quickfacts/table/PST045215/17|accessdate=29 iyun 2016}}</ref> ||align=center| {{nts|25}} || {{convert|57913,55|sqmi|km2|0|disp=table}} ||align=center| {{nts|24}} || {{convert|55518,93|sqmi|km2|0|disp=table}} || align=right| {{percentage|55518,93|57913,55|pad=2}} ||align=center| {{nts|19}} || {{convert|2394,62|sqmi|km2|0|disp=table}} || align=right| {{percentage|2394,62|57913,55|pad=2}} |
||
|- valign="top"|||||||||||||||||||| |
|- valign="top"|||||||||||||||||||| |
||
| {{flaqifikasiya|Ayova}} ||align=center| {{nts|26}} || {{convert|56272 |
| {{flaqifikasiya|Ayova}}<ref>{{cite web|title=Iowa QuickFacts from the US Census Bureau|url=http://www.census.gov/quickfacts/table/PST045215/19|accessdate=29 iyun 2016}}</ref> ||align=center| {{nts|26}} || {{convert|56272,81|sqmi|km2|0|disp=table}} ||align=center| {{nts|23}} || {{convert|55857,13|sqmi|km2|0|disp=table}} || align=right| {{percentage|55857,13|56272,81|pad=2}} ||align=center| {{nts|45}} || {{convert|415,68|sqmi|km2|0|disp=table}} || align=right| {{percentage|415,68|56272,81|pad=2}} |
||
|- valign="top"|||||||||||||||||||| |
|- valign="top"|||||||||||||||||||| |
||
| {{flaqifikasiya|Nyu-York}} ||align=center| {{nts|27}} || {{convert|54554 |
| {{flaqifikasiya|Nyu-York}}<ref>{{cite web|title=New-York QuickFacts from the US Census Bureau|url=http://www.census.gov/quickfacts/table/PST045215/36|accessdate=29 iyun 2016}}</ref> ||align=center| {{nts|27}} || {{convert|54554,98|sqmi|km2|0|disp=table}} ||align=center| {{nts|30}} || {{convert|47126,40|sqmi|km2|0|disp=table}} || align=right| {{percentage|47126,4|54554,98|pad=2}} ||align=center| {{nts|7}} || {{convert|7428,58|sqmi|km2|0|disp=table}} || align=right| {{percentage|7428,58|54554,98|pad=2}} |
||
|- valign="top"|||||||||||||||||||| |
|- valign="top"|||||||||||||||||||| |
||
| {{flaqifikasiya|Şimali Karolina}} ||align=center| {{nts|28}} || {{convert|53819 |
| {{flaqifikasiya|Şimali Karolina}}<ref>{{cite web|title=North Carolina QuickFacts from the US Census Bureau|url=http://www.census.gov/quickfacts/table/PST045215/37|accessdate=29 iyun 2016}}</ref> ||align=center| {{nts|28}} || {{convert|53819,16|sqmi|km2|0|disp=table}} ||align=center| {{nts|29}} || {{convert|48617,91|sqmi|km2|0|disp=table}} || align=right| {{percentage|48617,91|53819,16|pad=2}} ||align=center| {{nts|10}} || {{convert|5201,25|sqmi|km2|0|disp=table}} || align=right| {{percentage|5201,25|53819,16|pad=2}} |
||
|- valign="top"|||||||||||||||||||| |
|- valign="top"|||||||||||||||||||| |
||
| {{flaqifikasiya|Arkanzas}} ||align=center| {{nts|29}} || {{convert|53178 |
| {{flaqifikasiya|Arkanzas}}<ref>{{cite web|title=Arkansas QuickFacts from the US Census Bureau|url=http://www.census.gov/quickfacts/table/PST045215/04|accessdate=29 iyun 2016}}</ref> ||align=center| {{nts|29}} || {{convert|53178,55|sqmi|km2|0|disp=table}} ||align=center| {{nts|27}} || {{convert|52035,48|sqmi|km2|0|disp=table}} || align=right| {{percentage|52035,48|53178,55|pad=2}} ||align=center| {{nts|31}} || {{convert|1143,07|sqmi|km2|0|disp=table}} || align=right| {{percentage|1143,07|53178,55|pad=2}} |
||
|- valign="top"|||||||||||||||||||| |
|- valign="top"|||||||||||||||||||| |
||
| {{flaqifikasiya|Alabama}} ||align=center| {{nts|30}} || {{convert|52420 |
| {{flaqifikasiya|Alabama}}<ref>{{cite web|title=Alabama QuickFacts from the US Census Bureau|url=http://www.census.gov/quickfacts/table/PST045215/01|accessdate=29 iyun 2016}}</ref> ||align=center| {{nts|30}} || {{convert|52420,07|sqmi|km2|0|disp=table}} ||align=center| {{nts|28}} || {{convert|50645,33|sqmi|km2|0|disp=table}} || align=right| {{percentage|50645,33|52420,07|pad=2}} ||align=center| {{nts|23}} || {{convert|1774,74|sqmi|km2|0|disp=table}} || align=right| {{percentage|1774,74|52420,07|pad=2}} |
||
|- valign="top"|||||||||||||||||||| |
|- valign="top"|||||||||||||||||||| |
||
| {{flaqifikasiya|Luiziana}} ||align=center| {{nts|31}} || {{convert|52378 |
| {{flaqifikasiya|Luiziana}}<ref>{{cite web|title=Louisiana QuickFacts from the US Census Bureau|url=http://www.census.gov/quickfacts/table/PST045215/22|accessdate=29 iyun 2016}}</ref> ||align=center| {{nts|31}} || {{convert|52378,13|sqmi|km2|0|disp=table}} ||align=center| {{nts|33}} || {{convert|43203,90|sqmi|km2|0|disp=table}} || align=right| {{percentage|43203,9|52378,13|pad=2}} ||align=center| {{nts|5}} || {{convert|9174,23|sqmi|km2|0|disp=table}} || align=right| {{percentage|9174,23|52378,13|pad=2}} |
||
|- valign="top"|||||||||||||||||||| |
|- valign="top"|||||||||||||||||||| |
||
| {{flaqifikasiya|Missisipi}} ||align=center| {{nts|32}} || {{convert|48431 |
| {{flaqifikasiya|Missisipi}}<ref>{{cite web|title=Mississippi QuickFacts from the US Census Bureau|url=http://www.census.gov/quickfacts/table/PST045215/28|accessdate=29 iyun 2016}}</ref> ||align=center| {{nts|32}} || {{convert|48431,78|sqmi|km2|0|disp=table}} ||align=center| {{nts|31}} || {{convert|46923,27|sqmi|km2|0|disp=table}} || align=right| {{percentage|46923,27|48431,78|pad=2}} ||align=center| {{nts|25}} || {{convert|1508,51|sqmi|km2|0|disp=table}} || align=right| {{percentage|1508,51|48431,78|pad=2}} |
||
|- valign="top"|||||||||||||||||||| |
|- valign="top"|||||||||||||||||||| |
||
| {{flaqifikasiya|Pensilvaniya}} ||align=center| {{nts|33}} || {{convert|46054 |
| {{flaqifikasiya|Pensilvaniya}}<ref>{{cite web|title=Pennsylvania QuickFacts from the US Census Bureau|url=http://www.census.gov/quickfacts/table/PST045215/42|accessdate=29 iyun 2016}}</ref> ||align=center| {{nts|33}} || {{convert|46054,35|sqmi|km2|0|disp=table}} ||align=center| {{nts|32}} || {{convert|44742,70|sqmi|km2|0|disp=table}} || align=right| {{percentage|44742,7|46054,35|pad=2}} ||align=center| {{nts|28}} || {{convert|1311,64|sqmi|km2|0|disp=table}} || align=right| {{percentage|1311,64|46054,35|pad=2}} |
||
|- valign="top"|||||||||||||||||||| |
|- valign="top"|||||||||||||||||||| |
||
| {{flaqifikasiya|Ohayo}} ||align=center| {{nts|34}} || {{convert|44825 |
| {{flaqifikasiya|Ohayo}}<ref>{{cite web|title=Ohio QuickFacts from the US Census Bureau|url=http://www.census.gov/quickfacts/table/PST045215/42|accessdate=29 iyun 2016}}</ref> ||align=center| {{nts|34}} || {{convert|44825,58|sqmi|km2|0|disp=table}} ||align=center| {{nts|35}} || {{convert|40860,69|sqmi|km2|0|disp=table}} || align=right| {{percentage|40860,69|44825,58|pad=2}} ||align=center| {{nts|14}} || {{convert|3964,89|sqmi|km2|0|disp=table}} || align=right| {{percentage|3964,89|44825,58|pad=2}} |
||
|- valign="top"|||||||||||||||||||| |
|- valign="top"|||||||||||||||||||| |
||
| {{flaqifikasiya|Virciniya}} ||align=center| {{nts|35}} || {{convert|42774 |
| {{flaqifikasiya|Virciniya}}<ref>{{cite web|title=Virginia QuickFacts from the US Census Bureau|url=http://www.census.gov/quickfacts/table/PST045215/51|accessdate=29 iyun 2016}}</ref> ||align=center| {{nts|35}} || {{convert|42774,93|sqmi|km2|0|disp=table}} ||align=center| {{nts|36}} || {{convert|39490,09|sqmi|km2|0|disp=table}} || align=right| {{percentage|39490,09|42774,93|pad=2}} ||align=center| {{nts|15}} || {{convert|3284,84|sqmi|km2|0|disp=table}} || align=right| {{percentage|3284,84|42774,93|pad=2}} |
||
|- valign="top"|||||||||||||||||||| |
|- valign="top"|||||||||||||||||||| |
||
| {{flaqifikasiya|Tennessi}} ||align=center| {{nts|36}} || {{convert|42144 |
| {{flaqifikasiya|Tennessi}}<ref>{{cite web|title=Tennessee QuickFacts from the US Census Bureau|url=http://www.census.gov/quickfacts/table/PST045215/47|accessdate=29 iyun 2016}}</ref> ||align=center| {{nts|36}} || {{convert|42144,25|sqmi|km2|0|disp=table}} ||align=center| {{nts|34}} || {{convert|41234,90|sqmi|km2|0|disp=table}} || align=right| {{percentage|41234,9|42144,25|pad=2}} ||align=center| {{nts|35}} || {{convert|909,36|sqmi|km2|0|disp=table}} || align=right| {{percentage|909,36|42144,25|pad=2}} |
||
|- valign="top"|||||||||||||||||||| |
|- valign="top"|||||||||||||||||||| |
||
| {{flaqifikasiya|Kentukki}} ||align=center| {{nts|37}} || {{convert|40407 |
| {{flaqifikasiya|Kentukki}}<ref>{{cite web|title=Kentucky QuickFacts from the US Census Bureau|url=http://www.census.gov/quickfacts/table/PST045215/21|accessdate=29 iyun 2016}}</ref> ||align=center| {{nts|37}} || {{convert|40407,80|sqmi|km2|0|disp=table}} ||align=center| {{nts|37}} || {{convert|39486,34|sqmi|km2|0|disp=table}} || align=right| {{percentage|39486,34|40407,8|pad=2}} ||align=center| {{nts|34}} || {{convert|921,46|sqmi|km2|0|disp=table}} || align=right| {{percentage|921,46|40407,8|pad=2}} |
||
|- valign="top"|||||||||||||||||||| |
|- valign="top"|||||||||||||||||||| |
||
| {{flaqifikasiya|İndiana}} ||align=center| {{nts|38}} || {{convert|36419 |
| {{flaqifikasiya|İndiana}}<ref>{{cite web|title=Indiana QuickFacts from the US Census Bureau|url=http://www.census.gov/quickfacts/table/PST045215/18|accessdate=29 iyun 2016}}</ref> ||align=center| {{nts|38}} || {{convert|36419,55|sqmi|km2|0|disp=table}} ||align=center| {{nts|38}} || {{convert|35826,11|sqmi|km2|0|disp=table}} || align=right| {{percentage|35826,11|36419,55|pad=2}} ||align=center| {{nts|39}} || {{convert|593,44|sqmi|km2|0|disp=table}} || align=right| {{percentage|593,44|36419,55|pad=2}} |
||
|- valign="top"|||||||||||||||||||| |
|- valign="top"|||||||||||||||||||| |
||
| {{flaqifikasiya|Men}} ||align=center| {{nts|39}} || {{convert|35379 |
| {{flaqifikasiya|Men}}<ref>{{cite web|title=Maine QuickFacts from the US Census Bureau|url=http://www.census.gov/quickfacts/table/PST045215/23|accessdate=29 iyun 2016}}</ref> ||align=center| {{nts|39}} || {{convert|35379,74|sqmi|km2|0|disp=table}} ||align=center| {{nts|39}} || {{convert|30842,92|sqmi|km2|0|disp=table}} || align=right| {{percentage|30842,92|35379,74|pad=2}} ||align=center| {{nts|12}} || {{convert|4536,82|sqmi|km2|0|disp=table}} || align=right| {{percentage|4536,82|35379,74|pad=2}} |
||
|- valign="top"|||||||||||||||||||| |
|- valign="top"|||||||||||||||||||| |
||
| {{flaqifikasiya|Cənubi Karolina}} ||align=center| {{nts|40}} || {{convert|32020 |
| {{flaqifikasiya|Cənubi Karolina}}<ref>{{cite web|title=South Carolina QuickFacts from the US Census Bureau|url=http://www.census.gov/quickfacts/table/PST045215/45|accessdate=29 iyun 2016}}</ref> ||align=center| {{nts|40}} || {{convert|32020,49|sqmi|km2|0|disp=table}} ||align=center| {{nts|40}} || {{convert|30060,70|sqmi|km2|0|disp=table}} || align=right| {{percentage|30060,7|32020,49|pad=2}} ||align=center| {{nts|21}} || {{convert|1959,79|sqmi|km2|0|disp=table}} || align=right| {{percentage|1959,79|32020,49|pad=2}} |
||
|- valign="top"|||||||||||||||||||| |
|- valign="top"|||||||||||||||||||| |
||
| {{flaqifikasiya|Qərbi Virciniya}} ||align=center| {{nts|41}} || {{convert|24230 |
| {{flaqifikasiya|Qərbi Virciniya}}<ref>{{cite web|title=West Virginia QuickFacts from the US Census Bureau|url=http://www.census.gov/quickfacts/table/PST045215/54|accessdate=29 iyun 2016}}</ref> ||align=center| {{nts|41}} || {{convert|24230,04|sqmi|km2|0|disp=table}} ||align=center| {{nts|41}} || {{convert|24038,21|sqmi|km2|0|disp=table}} || align=right| {{percentage|24038,21|24230,04|pad=2}} ||align=center| {{nts|50}} || {{convert|191,83|sqmi|km2|0|disp=table}} || align=right| {{percentage|191,83|24230,04|pad=2}} |
||
|- valign="top"|||||||||||||||||||| |
|- valign="top"|||||||||||||||||||| |
||
| {{flaqifikasiya|Merilend}} ||align=center| {{nts|42}} || {{convert|12405 |
| {{flaqifikasiya|Merilend}}<ref>{{cite web|title=Maryland QuickFacts from the US Census Bureau|url=http://www.census.gov/quickfacts/table/PST045215/24|accessdate=29 iyun 2016}}</ref> ||align=center| {{nts|42}} || {{convert|12405,93|sqmi|km2|0|disp=table}} ||align=center| {{nts|42}} || {{convert|9707,24|sqmi|km2|0|disp=table}} || align=right| {{percentage|9707,24|12405,93|pad=2}} ||align=center| {{nts|18}} || {{convert|2698,69|sqmi|km2|0|disp=table}} || align=right| {{percentage|2698,69|12405,93|pad=2}} |
||
|- valign="top"|||||||||||||||||||| |
|- valign="top"|||||||||||||||||||| |
||
| {{flaqifikasiya|Havay}} ||align=center| {{nts|43}} || {{convert|10931 |
| {{flaqifikasiya|Havay}}<ref>{{cite web|title=Hawaii QuickFacts from the US Census Bureau|url=http://www.census.gov/quickfacts/table/PST045215/15|accessdate=29 iyun 2016}}</ref> ||align=center| {{nts|43}} || {{convert|10931,72|sqmi|km2|0|disp=table}} ||align=center| {{nts|47}} || {{convert|6422,63|sqmi|km2|0|disp=table}} || align=right| {{percentage|6422,63|10931,72|pad=2}} ||align=center| {{nts|13}} || {{convert|4509,09|sqmi|km2|0|disp=table}} || align=right| {{percentage|4509,09|10931,72|pad=2}} |
||
|- valign="top"|||||||||||||||||||| |
|- valign="top"|||||||||||||||||||| |
||
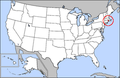
| {{flaqifikasiya|Massaçusets}} ||align=center| {{nts|44}} || {{convert|10554.39|sqmi|km2|0|disp=table}} ||align=center| {{nts|45}} || {{convert|7800.06|sqmi|km2|0|disp=table}} || align=right| {{percentage|7800.06|10554.39|pad=2}} ||align=center| {{nts|16}} || {{convert|2754.33|sqmi|km2|0|disp=table}} || align=right| {{percentage|2754.33|10554.39|pad=2}} |
| {{flaqifikasiya|Massaçusets}} ||align=center| {{nts|44}} || {{convert|10554.39|sqmi|km2|0|disp=table}} ||align=center| {{nts|45}} || {{convert|7800.06|sqmi|km2|0|disp=table}} || align=right| {{percentage|7800.06|10554.39|pad=2}} ||align=center| {{nts|16}} || {{convert|2754.33|sqmi|km2|0|disp=table}} || align=right| {{percentage|2754.33|10554.39|pad=2}} |
||
04:38, 29 iyun 2016 tarixindəki versiya

Bu siyahıda ABŞ və mülklərinin ümumi ərazi, quru və su ərazisinə görə sıralanmışdır. Su sahəsinə daxili sular, sahil suları, Böyük göllər və məhəlli sular daxildir. Buzlaqlar və daimi olmayan sular quru ərazisi kimi hesablanmışdır.[1][2]
ABŞ-ın ən böyük ştatı olan Alyaska ümumi ərazisinə, quru ərazisinə və su ərazisinə görə birinci yerdə dayanır. Alyaskanın ümumi ABŞ ərazisinin 18%-ni, və qitə ərazisinin 21%-ini təşkil edir. İkinci böyük ştat olan Texas, Alyaskanın 40%-i qədər əraziyə malikdir. Su ərazisinə görə isə ikinci yerdə Miçiqan dayanır. Rod-Aylend ümumi və quru ərazisinə görə ən kiçik ştatdır. Su ərazisinə görə isə axırıncı yeri Qərbi Virciniya tutur.
San Bernardino qraflığı qitə ərazisində ən böyük qraflıqdır.[3] Ümumi ərazisi 200.000 mil² (520.000 km2)-dən daha böyükdür.[4] Ən kiçik doqquz ştatdan daha böyükdür və ən kiçik dörd ştatın ümumi ərazisindən də böyükdür.[5][6] Hətta ərazisi 71 müstəqil ölkənin ərazidsisindən də böyükdür.[7]
Ərazisinə görə ştat/mülk
| Rənglərin göstəriciləri | |
|---|---|
| Ştat | |
| Federal Dairə | |
| Mülk | |
| Ümumi | |
| Ümumi ərazi[8][9] | Quru ərazi[8][9] | Su[8][9] | |||||||||
|---|---|---|---|---|---|---|---|---|---|---|---|
| Ştat/mülk | Sıra | mil² | km² | Sıra | mil² | km² | % quru | Sıra | mil² | km² | % su |
| 1 | 66,538,404 | 172,333,675 | 1 | 57,064,095 | 147,795,328 | 85,76% | 1 | 9,474,310 | 24,538,350 | 14,24% | |
| 2 | 26,859,646 | 69,566,164 | 2 | 26,123,171 | 67,658,702 | 97,26% | 8 | 736,475 | 1,907,461 | 2,74% | |
| 3 | 16,369,474 | 42,396,743 | 3 | 15,577,922 | 40,346,633 | 95,16% | 6 | 791,552 | 2,050,110 | 4,84% | |
| 4 | 14,703,971 | 38,083,110 | 4 | 14,554,580 | 37,696,189 | 98,98% | 26 | 149,391 | 386,921 | 1,02% | |
| 5 | 12,159,030 | 31,491,743 | 5 | 12,129,815 | 31,416,077 | 99,76% | 49 | 29,215 | 75,667 | 0,24% | |
| 6 | 11,399,030 | 29,523,352 | 6 | 11,359,408 | 29,420,732 | 99,65% | 48 | 39,622 | 102,621 | 0,35% | |
| 7 | 11,057,182 | 28,637,970 | 7 | 10,978,118 | 28,433,195 | 99,28% | 36 | 79,065 | 204,777 | 0,72% | |
| 8 | 10,409,367 | 26,960,137 | 8 | 10,364,189 | 26,843,126 | 99,57% | 44 | 45,178 | 117,010 | 0,43% | |
| 9 | 9,837,854 | 25,479,925 | 10 | 9,598,801 | 24,860,780 | 97,57% | 20 | 239,053 | 619,144 | 2,43% | |
| 10 | 9,781,301 | 25,333,453 | 9 | 9,709,314 | 25,147,008 | 99,26% | 37 | 71,987 | 186,445 | 0,74% | |
| 11 | 9,671,351 | 25,048,684 | 22 | 5,653,890 | 14,643,508 | 58,46% | 2 | 4,017,461 | 10,405,176 | 41,54% | |
| 12 | 8,693,583 | 22,516,277 | 14 | 7,962,674 | 20,623,231 | 91,59% | 9 | 730,909 | 1,893,046 | 8,41% | |
| 13 | 8,489,688 | 21,988,191 | 12 | 8,216,962 | 21,281,834 | 96,79% | 17 | 272,726 | 706,357 | 3,21% | |
| 14 | 8,356,895 | 21,644,259 | 11 | 8,264,312 | 21,404,470 | 98,89% | 33 | 92,583 | 239,789 | 1,11% | |
| 15 | 8,227,836 | 21,309,997 | 13 | 8,175,872 | 21,175,411 | 99,37% | 42 | 51,964 | 134,586 | 0,63% | |
| 16 | 7,734,781 | 20,032,991 | 15 | 7,682,417 | 19,897,369 | 99,32% | 41 | 52,364 | 135,622 | 0,68% | |
| 17 | 7,711,568 | 19,972,869 | 16 | 7,581,100 | 19,634,959 | 98,31% | 29 | 130,468 | 337,911 | 1,69% | |
| 18 | 7,129,795 | 18,466,084 | 20 | 6,645,552 | 17,211,901 | 93,21% | 11 | 484,243 | 1,254,184 | 6,79% | |
| 19 | 7,069,832 | 18,310,781 | 17 | 6,900,080 | 17,871,125 | 97,60% | 24 | 169,752 | 439,656 | 2,40% | |
| 20 | 6,989,887 | 18,103,724 | 19 | 6,859,492 | 17,766,003 | 98,13% | 30 | 130,395 | 337,721 | 1,87% | |
| 21 | 6,970,699 | 18,054,028 | 18 | 6,874,152 | 17,803,972 | 98,61% | 32 | 96,547 | 250,056 | 1,39% | |
| 22 | 6,575,770 | 17,031,166 | 26 | 5,362,476 | 13,888,749 | 81,55% | 3 | 1,213,294 | 3,142,417 | 18,45% | |
| 23 | 6,549,638 | 16,963,485 | 25 | 5,415,780 | 14,026,806 | 82,69% | 4 | 1,133,857 | 2,936,676 | 17,31% | |
| 24 | 5,942,515 | 15,391,043 | 21 | 5,751,349 | 14,895,926 | 96,78% | 22 | 191,166 | 495,118 | 3,22% | |
| 25 | 5,791,355 | 14,999,541 | 24 | 5,551,893 | 14,379,337 | 95,87% | 19 | 239,462 | 620,204 | 4,13% | |
| 26 | 5,627,281 | 14,574,591 | 23 | 5,585,713 | 14,466,930 | 99,26% | 45 | 41,568 | 107,661 | 0,74% | |
| 27 | 5,455,498 | 14,129,675 | 30 | 4,712,640 | 12,205,682 | 86,38% | 7 | 742,858 | 1,923,993 | 13,62% | |
| 28 | 5,381,916 | 13,939,098 | 29 | 4,861,791 | 12,591,981 | 90,34% | 10 | 520,125 | 1,347,118 | 9,66% | |
| 29 | 5,317,855 | 13,773,181 | 27 | 5,203,548 | 13,477,127 | 97,85% | 31 | 114,307 | 296,054 | 2,15% | |
| 30 | 5,242,007 | 13,576,736 | 28 | 5,064,533 | 13,117,080 | 96,61% | 23 | 177,474 | 459,656 | 3,39% | |
| 31 | 5,237,813 | 13,565,873 | 33 | 4,320,390 | 11,189,759 | 82,48% | 5 | 917,423 | 2,376,115 | 17,52% | |
| 32 | 4,843,178 | 12,543,773 | 31 | 4,692,327 | 12,153,071 | 96,89% | 25 | 150,851 | 390,702 | 3,11% | |
| 33 | 4,605,435 | 11,928,022 | 32 | 4,474,270 | 11,588,306 | 97,15% | 28 | 131,164 | 339,713 | 2,85% | |
| 34 | 4,482,558 | 11,609,772 | 35 | 4,086,069 | 10,582,870 | 91,15% | 14 | 396,489 | 1,026,902 | 8,85% | |
| 35 | 4,277,493 | 11,078,656 | 36 | 3,949,009 | 10,227,886 | 92,32% | 15 | 328,484 | 850,770 | 7,68% | |
| 36 | 4,214,425 | 10,915,311 | 34 | 4,123,490 | 10,679,790 | 97,84% | 35 | 90,936 | 235,523 | 2,16% | |
| 37 | 4,040,780 | 10,465,572 | 37 | 3,948,634 | 10,226,915 | 97,72% | 34 | 92,146 | 238,657 | 2,28% | |
| 38 | 3,641,955 | 9,432,620 | 38 | 3,582,611 | 9,278,920 | 98,37% | 39 | 59,344 | 153,700 | 1,63% | |
| 39 | 3,537,974 | 9,163,311 | 39 | 3,084,292 | 7,988,280 | 87,18% | 12 | 453,682 | 1,175,031 | 12,82% | |
| 40 | 3,202,049 | 8,293,269 | 40 | 3,006,070 | 7,785,686 | 93,88% | 21 | 195,979 | 507,583 | 6,12% | |
| 41 | 2,423,004 | 6,275,552 | 41 | 2,403,821 | 6,225,868 | 99,21% | 50 | 19,183 | 49,684 | 0,79% | |
| 42 | 1,240,593 | 3,213,121 | 42 | 970,724 | 2,514,164 | 78,25% | 18 | 269,869 | 698,958 | 21,75% | |
| 43 | 1,093,172 | 2,831,302 | 47 | 642,263 | 1,663,454 | 58,75% | 13 | 450,909 | 1,167,849 | 41,25% | |
| 44 | 10,554.39 | 27,336 | 45 | 7,800.06 | 20,202 | 73,90% | 16 | 2,754.33 | 7,134 | 26,10% | |
| 45 | 9,616.36 | 24,906 | 43 | 9,216.66 | 23,871 | 95,84% | 46 | 399.71 | 1,035 | 4,16% | |
| 46 | 9,349.16 | 24,214 | 44 | 8,952.65 | 23,187 | 95,76% | 47 | 396.51 | 1,027 | 4,24% | |
| 47 | 8,722.58 | 22,591 | 46 | 7,354.22 | 19,047 | 84,31% | 27 | 1,368.36 | 3,544 | 15,69% | |
| 48 | 5,543.41 | 14,357 | 48 | 4,842.36 | 12,542 | 87,35% | 38 | 701.06 | 1,816 | 12,65% | |
| 49 | 2,488.72 | 6,446 | 49 | 1,948.54 | 5,047 | 78,29% | 40 | 540.18 | 1,399 | 21,71% | |
| 50 | 1,544.89 | 4,001 | 50 | 1,033.81 | 2,678 | 66,92% | 43 | 511.07 | 1,324 | 33,08% | |
| Şablon:Flaqifikasiya/Kolumbiya Dairəsi | 68.34 | 177 | 61.05 | 158 | 89,33% | 7.29 | 19 | 10,67% | |||
| 5,324.84 | 13,791 | 3,423.78 | 8,868 | 64,30% | 1,901.07 | 4,924 | 35,70% | ||||
| 1,975.57 | 5,117 | 182.33 | 472 | 9,23% | 1,793.24 | 4,644 | 90,77% | ||||
| 732.93 | 1,898 | 134.32 | 348 | 18,33% | 598.61 | 1,550 | 81,67% | ||||
| 581.05 | 1,505 | 76.46 | 198 | 13,16% | 504.60 | 1,307 | 8,68% | ||||
| 570.62 | 1,478 | 209.80 | 543 | 3,68% | 360.82 | 935 | 63,23% | ||||
| 16.00 | 41 | 16.00 | 41 | — | — | — | — | ||||
| Ümumi | 3,120,426.47 | 8,081,867 | 2,954,841.42 | 7,653,004 | 94,69% | 165,584.6 | 428,862 | 0,53% | |||
| Ümumi | 3,796,742.23 | 9,833,517 | 3,531,905.43 | 9,147,593 | 93,02% | 264,836.79 | 685,924 | 6,98% | |||
| Ümumi | 3,805,943.26 | 9,857,348 | 3,535,948.12 | 9,158,064 | 92,91% | 269,995.13 | 699,284 | 7,09% | |||
Ərazisinə görə dairələr
Aşağıdakı bütün dairələr ABŞ Siyahıyaalma Bürosu tərəfindən müəyyənləşdirilib.
| Ümumi ərazi[8] | Quru[8] | Su[8] | |||||||||
|---|---|---|---|---|---|---|---|---|---|---|---|
| Dairə | Sıra | mil² | km² | Sıra | mil² | km² | % quru | Sıra | mil² | km² | % su |
| Şərq Şimali Mərkəz | 5 | 30,136,857 | 78,054,101 | 6 | 24,290,244 | 62,911,443 | 2 | 5,846,613 | 15,142,658 | ||
| Şərq Cənubi Mərkəz | 7 | 183,403.89 | 475,014 | 7 | 178,289.83 | 461,769 | 9 | 5,114.60 | 13,247 | ||
| Orta Atlantik | 8 | 109,331.89 | 283,168 | 8 | 99,223.32 | 256,987 | 6 | 10,108.57 | 26,181 | ||
| Dağ | 2 | 863,564.63 | 2,236,622 | 2 | 855,766.98 | 2,216,426 | 8 | 7,797.65 | 20,196 | ||
| Yeni İngiltərə | 9 | 71,987.96 | 186,448 | 9 | 62,668.46 | 162,311 | 7 | 9,299.50 | 24,086 | ||
| Pasifik | 1 | 1,009,687.00 | 2,615,077 | 1 | 895,286.33 | 2,318,781 | 1 | 114,400.67 | 296,296 | ||
| Cənubi Atlantik | 6 | 292,990.46 | 758,842 | 5 | 265,061.97 | 686,507 | 3 | 27,928.49 | 72,334 | ||
| Şərq Cənubi Mərkəz | 3 | 520,355.80 | 1,347,715 | 3 | 507,620.08 | 1,314,730 | 5 | 12,735.72 | 32,985 | ||
| Qərb Cənubi Mərkəz | 4 | 444,052.01 | 1,150,089 | 4 | 425,066.01 | 1,100,916 | 4 | 18,986.00 | 49,174 | ||
Ərazisinə görə rayonlar
Aşağıdakı bütün rayonlar ABŞ Siyahıyaalma Bürosu tərəfindən müəyyənləşdirilib.
| Ümumi sahə[8] | Quru[8] | Su[8] | |||||||||
|---|---|---|---|---|---|---|---|---|---|---|---|
| Rayon | Sıra | mil² | km² | Sıra | mil² | km² | % quru | Sıra | mil² | km² | % su |
| Orta Qərb | 3 | 821,724.38 | 2,128,256 | 3 | 750,522.52 | 1,943,844 | 2 | 71,201.86 | 184,412 | ||
| Şimal Şərq | 4 | 181,319.85 | 469,616 | 4 | 161,911.78 | 419,350 | 4 | 19,408.07 | 50,267 | ||
| Cənub | 2 | 920,446.37 | 2,383,945 | 2 | 868,417.82 | 2,249,192 | 3 | 52,028.55 | 134,753 | ||
| Qərb | 1 | 1,873,251.63 | 4,851,699 | 1 | 1,751,053.31 | 4,535,207 | 1 | 122,198.32 | 316,492 | ||
-
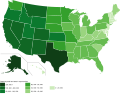
 Ümumi ərazisinə görə ABŞ ştatları.
 -
 Quru ərazisinə görə ABŞ ştatları.
 -
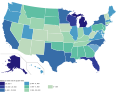 Su ərazisinə görə ABŞ ştatları.
 -
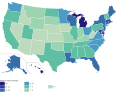 Su faizinə görə ABŞ ştatları.
 -
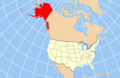 Alyaska ümumi ərazisinə, quru ərazisinə və su ərazisinə görə ən böyük ştatdır.
 -
 Alyaskanın ərazisi ABŞ ərazisinin 18%-ni, və qitə ərazisinin 21%-ini təşkil edir.
 -
 İkinci böyük ştat olan Texas, Alyaskanın ümumi ərazisinin 40%-i qədərdir.
 -
 Rod-Aylend ümumi və quru ərazisinə görə ən kiçik ştatdır.
 -
 San Bernardino qraflığı qitə ərazisində ən böyük qraflıqdır və ən kiçik doqquz ştatdan daha böyükdür. Ən kiçik dörd ştatın ümumi ərazisindən də böyükdür.
 -
 Miçiqan su sahəsinə görə Alyaskadan sonra ikinci və su faizinə görə isə birincidir.
 -
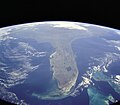 Florida əsasən yarımadadan təşkil olunub və su sahəsinə görə üçüncü və su faizinə görə isə yeddincidir.


İstinadlar
- ↑ Census 2000 Geographic Terms and Concepts, Census 2000 Geography Glossary, U.S. Census Bureau. Accessed 2007-07-10
- ↑ "Chapter 15 - Area Measurement/Water Classification of the Geographic Areas Reference Manual" (PDF). ABŞ Siyahıyaalma Bürosu. İstifadə tarixi: 21 iyun 2016.
- ↑ "About San Bernardino County". San Bernardino County District Attorney. İstifadə tarixi: 23 iyun 2016.
- ↑ "QuickFacts San Bernardino County, California". ABŞ Siyahıyaalma Bürosu. İstifadə tarixi: 23 iyun 2016.
- ↑ "San Bernardino County". TNG Real Estate. İstifadə tarixi: 23 iyun 2016.
- ↑ "Colleges In San Bernardino County". CaliforniaColleges.com. İstifadə tarixi: 23 iyun 2016.
- ↑ "Comparing the Size of San Bernardino County and its Legal Elements With States". Bosco Legal Services. İstifadə tarixi: 23 iyun 2016.
- ↑ 1 2 3 4 5 6 7 8 9 10 "United States Summary: 2010, Population and Housing Unit Counts, 2010 Census of Population and Housing" (PDF) (PDF). United States Census Bureau. September 2012. V–2, 1 & 41 (Tables 1 & 18). İstifadə tarixi: February 7, 2014.
- ↑ 1 2 3 "State Area Measurements and Internal Point Coordinates". ABŞ Siyahıyaalma Bürosu. İstifadə tarixi: 21 iyun 2016.
- ↑ "Alaska QuickFacts from the US Census Bureau". İstifadə tarixi: 25 iyun 2016.
- ↑ "Geography of Alaska". İstifadə tarixi: 25 iyun 2016.
- ↑ "Texas QuickFacts from the US Census Bureau". İstifadə tarixi: 25 iyun 2016.
- ↑ "Facts". Texas Almanac. İstifadə tarixi: 25 iyun 2016.
- ↑ "California QuickFacts from the US Census Bureau". İstifadə tarixi: 25 iyun 2016.
- ↑ "LAND AND WATER AREAS OF CALIFORNIA COUNTIES" (pdf). İstifadə tarixi: 25 iyun 2016.
- ↑ "Montana QuickFacts from the US Census Bureau". İstifadə tarixi: 25 iyun 2016.
- ↑ "Area of Montana Counties". İstifadə tarixi: 25 iyun 2016.
- ↑ "New Mexico QuickFacts from the US Census Bureau". İstifadə tarixi: 25 iyun 2016.
- ↑ "New Mexico Climate & Geography". İstifadə tarixi: 25 iyun 2016.
- ↑ "Arizona QuickFacts from the US Census Bureau". İstifadə tarixi: 25 iyun 2016.
- ↑ "Arizona Facts". İstifadə tarixi: 25 iyun 2016.
- ↑ "Nevada QuickFacts from the US Census Bureau". İstifadə tarixi: 28 iyun 2016.
- ↑ "Nevada Facts and State Emblems". Nevada Legislative. İstifadə tarixi: 28 iyun 2016.
- ↑ "Colorado QuickFacts from the US Census Bureau". İstifadə tarixi: 28 iyun 2016.
- ↑ "Oregon QuickFacts from the US Census Bureau". İstifadə tarixi: 28 iyun 2016.
- ↑ "Oregon Fast Facts". Oregon Tourism Commission. İstifadə tarixi: 28 iyun 2016.
- ↑ "Wyoming QuickFacts from the US Census Bureau". İstifadə tarixi: 28 iyun 2016.
- ↑ "Wyoming Facts and Symbols". State of Wyoming. İstifadə tarixi: 28 iyun 2016.
- ↑ "Michigan QuickFacts from the US Census Bureau". İstifadə tarixi: 28 iyun 2016.
- ↑ Shepherd, Jessica. "Happy birthday, Michigan! 50 facts to celebrate the mitten state". MLive Media Group. 26 yanvar 2016. İstifadə tarixi: 28 iyun 2016.
- ↑ "Minnesota QuickFacts from the US Census Bureau". İstifadə tarixi: 29 iyun 2016.
- ↑ "Utah QuickFacts from the US Census Bureau". İstifadə tarixi: 29 iyun 2016.
- ↑ "Idaho QuickFacts from the US Census Bureau". İstifadə tarixi: 29 iyun 2016.
- ↑ "Kansas QuickFacts from the US Census Bureau". İstifadə tarixi: 29 iyun 2016.
- ↑ "Nebraska QuickFacts from the US Census Bureau". İstifadə tarixi: 29 iyun 2016.
- ↑ "South Dakota QuickFacts from the US Census Bureau". İstifadə tarixi: 29 iyun 2016.
- ↑ "Washington QuickFacts from the US Census Bureau". İstifadə tarixi: 29 iyun 2016.
- ↑ "North Dakota QuickFacts from the US Census Bureau". İstifadə tarixi: 29 iyun 2016.
- ↑ "Oklahoma QuickFacts from the US Census Bureau". İstifadə tarixi: 29 iyun 2016.
- ↑ "Missouri QuickFacts from the US Census Bureau". İstifadə tarixi: 29 iyun 2016.
- ↑ "Florida QuickFacts from the US Census Bureau". İstifadə tarixi: 29 iyun 2016.
- ↑ "Wisconsin QuickFacts from the US Census Bureau". İstifadə tarixi: 29 iyun 2016.
- ↑ "Georgia QuickFacts from the US Census Bureau". İstifadə tarixi: 29 iyun 2016.
- ↑ "Illinois QuickFacts from the US Census Bureau". İstifadə tarixi: 29 iyun 2016.
- ↑ "Iowa QuickFacts from the US Census Bureau". İstifadə tarixi: 29 iyun 2016.
- ↑ "New-York QuickFacts from the US Census Bureau". İstifadə tarixi: 29 iyun 2016.
- ↑ "North Carolina QuickFacts from the US Census Bureau". İstifadə tarixi: 29 iyun 2016.
- ↑ "Arkansas QuickFacts from the US Census Bureau". İstifadə tarixi: 29 iyun 2016.
- ↑ "Alabama QuickFacts from the US Census Bureau". İstifadə tarixi: 29 iyun 2016.
- ↑ "Louisiana QuickFacts from the US Census Bureau". İstifadə tarixi: 29 iyun 2016.
- ↑ "Mississippi QuickFacts from the US Census Bureau". İstifadə tarixi: 29 iyun 2016.
- ↑ "Pennsylvania QuickFacts from the US Census Bureau". İstifadə tarixi: 29 iyun 2016.
- ↑ "Ohio QuickFacts from the US Census Bureau". İstifadə tarixi: 29 iyun 2016.
- ↑ "Virginia QuickFacts from the US Census Bureau". İstifadə tarixi: 29 iyun 2016.
- ↑ "Tennessee QuickFacts from the US Census Bureau". İstifadə tarixi: 29 iyun 2016.
- ↑ "Kentucky QuickFacts from the US Census Bureau". İstifadə tarixi: 29 iyun 2016.
- ↑ "Indiana QuickFacts from the US Census Bureau". İstifadə tarixi: 29 iyun 2016.
- ↑ "Maine QuickFacts from the US Census Bureau". İstifadə tarixi: 29 iyun 2016.
- ↑ "South Carolina QuickFacts from the US Census Bureau". İstifadə tarixi: 29 iyun 2016.
- ↑ "West Virginia QuickFacts from the US Census Bureau". İstifadə tarixi: 29 iyun 2016.
- ↑ "Maryland QuickFacts from the US Census Bureau". İstifadə tarixi: 29 iyun 2016.
- ↑ "Hawaii QuickFacts from the US Census Bureau". İstifadə tarixi: 29 iyun 2016.
- ↑ "United States Summary: 2010, Population and Housing Unit Counts, 2000 Census of Population and Housing" (PDF) (PDF). United States Census Bureau. April 2004. səh. 1 (Table 1). İstifadə tarixi: February 10, 2014.
- ↑ Əvvəlki illərdən fərqli olaraq ABŞ Siyahıyaalma Bürosu kiçik adacıqlarda məlumat toplamadığı üçün 2010-cu il siyahıyaalınma haqqında məlumatlarda sahə qeyd edilməyib.[8]